https://www.codewall.co.uk/debug-php-in-vscode-with-xdebug
Enable remote debugging in your
php.ini:For Xdebug v3.x.x:
xdebug.mode = debug
xdebug.start_with_request = yes
For Xdebug v2.x.x:
xdebug.remote_enable = 1
xdebug.remote_autostart = 1
xdebug.remote_port = 9000
Se instaleaza extensia de Visual Studio Code:
Se instaleaza extensia de chrome:
- Goto the following URL https://chrome.google.com/webstore/category/extensions
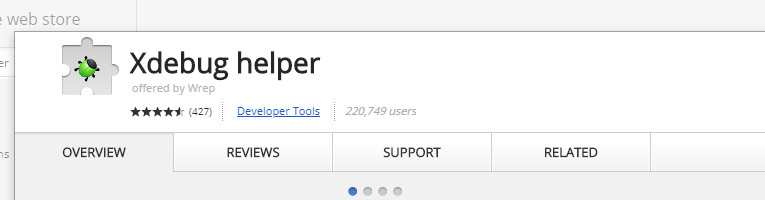
- Search for ‘xDebug Helper’
- Install the extension (It has a green ladybug in the logo) – See image below.
Listen for xDebug
Now, let’s go through the ‘Listen for xDebug method which takes the browser into account.
- Open a .php file, for this example the index.php file in the root directory.
- Add some code and add some breakpoints. Use F9 shortcut key to add breakpoints.
- Change the Debug select option to ‘Listen for xDebug’.
- Press F5 to start the debugger.
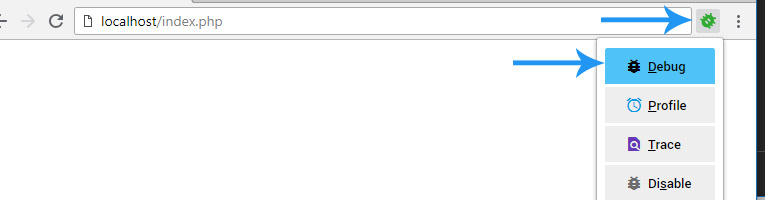
- Open Chrome and navigate to your index.php file, in my case its http://localhost/index.php
- Click the new XDebug Helper extension and click the Debug option.
- You will notice the helper icon will now turn green (See image below)
- Finally, refresh the page in the browser, and VSCode will react and start the debugging process.
- Go back into VSCode and you will see that it has stopped at the breakpoint.